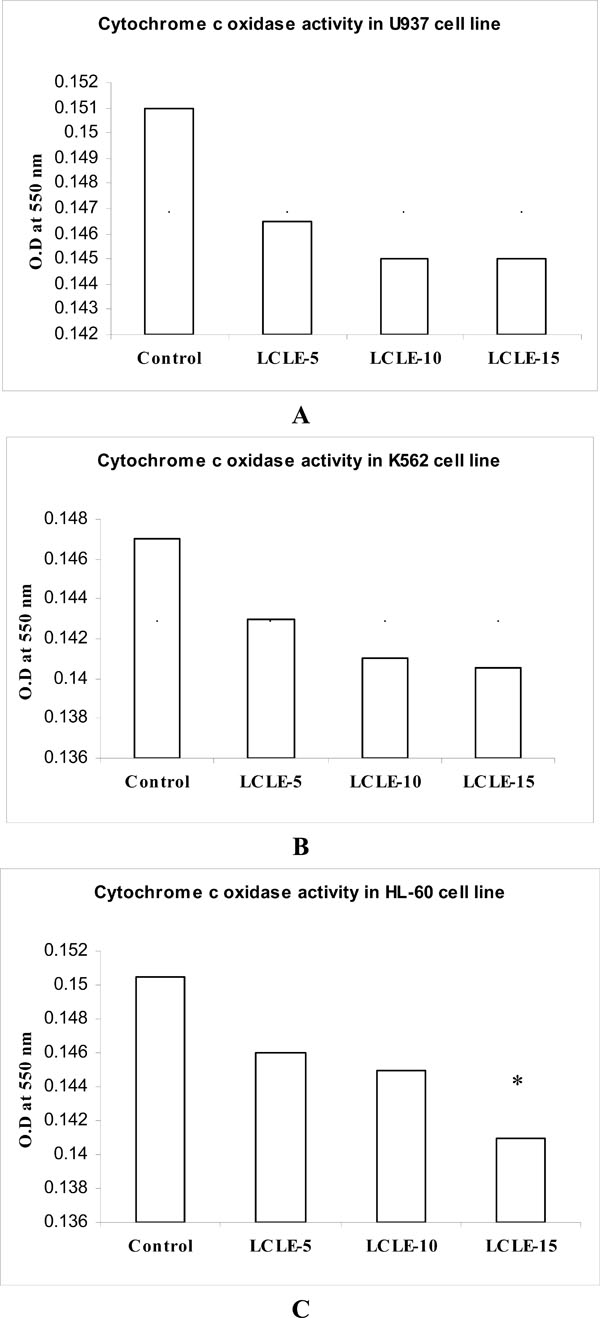
Fig. (8) Effect of LCLE treatment on cytochome c oxidase activity
in U937, K562 and HL-60 cells. (A) histogram representation of
cytochrome c oxidase activity in the cytosolic extracts of untreated
control and LCLE (50, 100 and 150 µg/ml) treated U937 cells, (B)
histogram representation of cytochrome c oxidase activity in the
cytosolic extract of untreated control and LCLE (50, 100 and 150
µg/ml) treated K562 cells and (C) histogram representation of cytochrome
c oxidase activity in cytosolic extract of untreated control
and LCLE (50, 100 and 150 µg/ml) treated HL-60 cells. The SE
value was < 0.001 at all points.