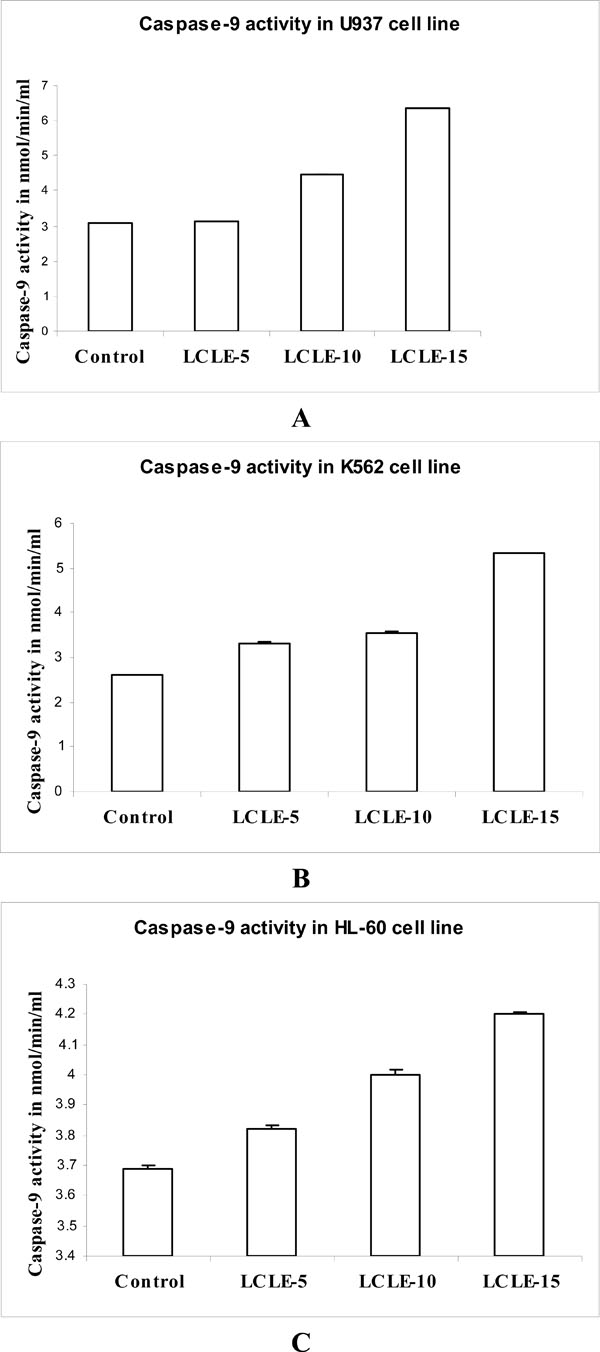
Fig. (9) Effect of LCLE treatment on Caspase-9 activity in U937,
K562 and HL-60 cells. (A) histogram representation of caspase-9
activity in untreated control and LCLE (50, 100 and 150 µg/ml)
treated U937 cells, (B) histogram representation of caspase-9 activity
in untreated control and LCLE (50,100 and 150 µg/ml) treated
K562 cells and (C) histogram representation of caspase-9 activity in
untreated control and LCLE (50, 100 and 150 µg/ml) treated HL-60
cells. The SE value was < 0.001 in bars where no indication is
shown for SE.