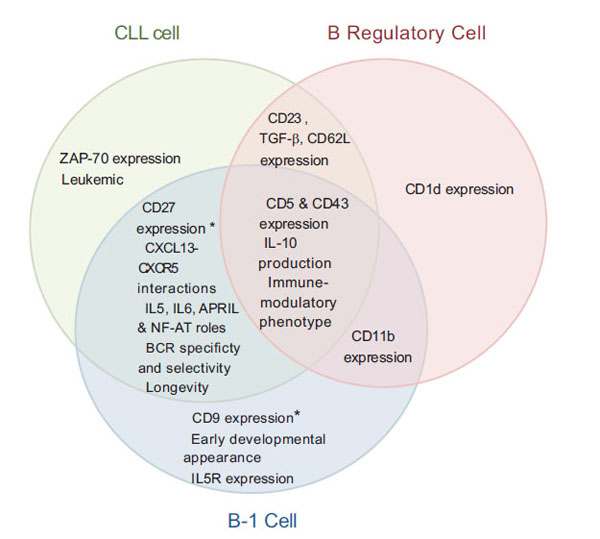
Fig. (1) Representative Venn diagram highlighting numerous similarities and differences in expression and/or phenotypic patterns between
CLL, B-1, and B Regulatory cells, as suggested by current literature. * Denotes notable similarities also shared with MZ B cells [16, 19, 20,
26, 29, 30, 34, 50-53].