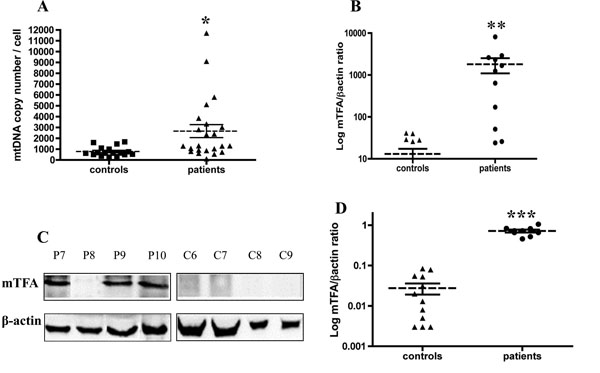
Fig. (1) Analysis of mtDNA and mTFA in leukemic patients and healthy subjects. (A) The mtDNA/nDNA ratio was determined by realtime
PCR using primers directed against both mitochondrial and nuclear genes. Data are mean +/- S.E.M. *, P < 0.05. (B) mRNAs
expression of mTFA was determined by Q-PCR in 11/23 leukemic patients and 9/18 healthy controls. Results are expressed as the mTFA/β
actin ratio and correspond to the mean +/- S.E.M. **, P < 0.01. (C, D) The mTFA level was determined by western-blot in 9/23 leukemic
patients and 13/18 healthy controls. Results are expressed as the mTFA/β actin ratio and correspond to the mean +/- S.E.M. ***, P<0.001.