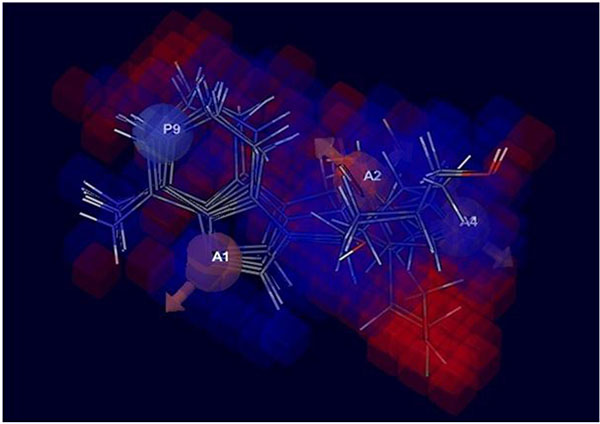
Fig. (4)
3D-QSAR visualization of various substituents’ effect: Blue cubes showing positive potential beside red cubes showing negative potential of particular substitution.