Table 1: Observed and predicted activities of the training, test and new test sets based on the model1. Activities were shown as pIC50 (µM). a: Test set, b: new test set. They are provided as an example data set in the package.
| Name |
R |
Observed pIC50
|
Predicted pIC50 values |
Residues |
| n1 |
 |
1.89 |
1.62 |
0.27 |
| n2 |
 |
1.82 |
2.19 |
-0.37 |
| n3 |
 |
3.15 |
2.57 |
0.58 |
| n4a
|
 |
1.64 |
1.93 |
-0.29 |
| n5b
|
 |
1.74 |
1.67 |
0.07 |
| n6 |
 |
2.66 |
2.82 |
-0.16 |
| n7 a
|
 |
3.40 |
4.02 |
-0.62 |
| n8 |
 |
4.00 |
3.72 |
0.28 |
| n9 |
 |
4.00 |
3.94 |
0.06 |
| n10 |
 |
3.70 |
3.78 |
-0.08 |
| n11 |
 |
3.70 |
3.69 |
0.01 |
| n12 |
 |
3.00 |
2.39 |
0.61 |
| n13 b
|
 |
3.39 |
3.06 |
0.33 |
| n14 a
|
 |
3.00 |
3.08 |
-0.08 |
| n15 |
 |
2.92 |
3.10 |
-0.17 |
| n16 |
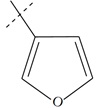
Methyl |
2.07 |
2.64 |
-0.58 |
| n17 |
Ethyl |
2.54 |
2.31 |
0.22 |
| n18 |
i-Propyl |
2.35 |
2.38 |
-0.03 |
| n19 |
t-Butyl |
1.77 |
1.10 |
0.67 |
| n20 |
i-Butyl |
2.27 |
2.28 |
-0.01 |
| n21 |
CH2OCH3 |
2.72 |
2.22 |
0.50 |
| n22 |
CF3 |
2.66 |
2.69 |
-0.04 |
| n23 |
Cyclopropyl |
2.80 |
2.46 |
0.33 |
| n24 a
|
Cyclobutyl |
2.64 |
2.43 |
0.21 |
| n25 b
|
Cyclohexyl |
2.14 |
2.48 |
-0.34 |
| n26 |
Phenyl |
2.40 |
2.62 |
-0.22 |
| n27 |
 |
3.52 |
3.78 |
-0.26 |