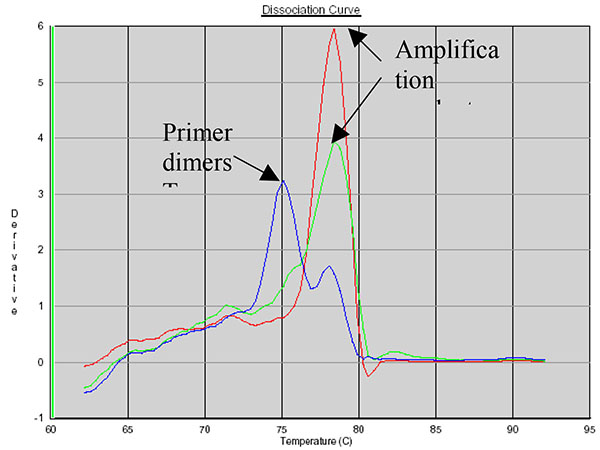
Fig. (7)
Dissociation curves of amplification products with B-actin primers. Red, pDNA as template; green, gDNA as template; blue, NTC.