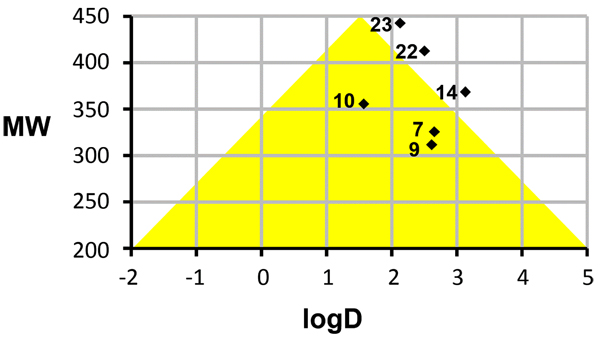
Fig. (3)
Active analogs mapping onto or near the optimal ‘Golden Triangle’ zone (yellow) are shown on a molecular weight (MW)
versus
LogD correlation plot.