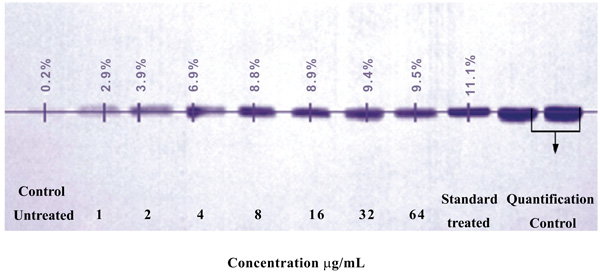
Fig. (2)
Desnsity analysis of Western Blot of treated B16F10 melanocytes. The inhibited cells (band 1) showed 0.2% band density revealing a trace amount of tyrosinase in the cell under study. The band intensity of 2-5 bands had a steady increase from 2.7, 3.7, 6.7 and 8.6% respectively showed the increased absorption with the increased quantity of treated tyrosinase. Rather (band 5-8) had an increase in the absorption quantity 8.7-9.3%; however the rate of increase is lower as compared to the bands 2-5. The average variations between the treatments were 1, 3, 1.9, 0.1, 0.5, and 0.1% respectively from the bands 2-7. The tyrosinase proteins were visualized by Quantity one software.