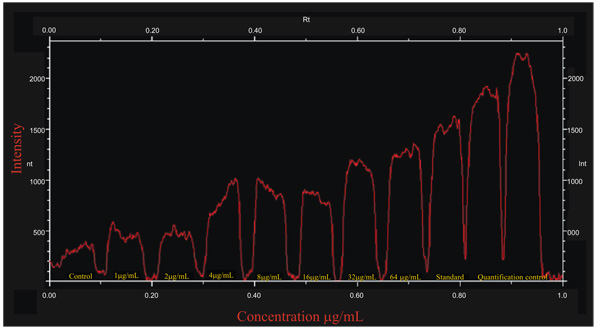
Fig. (3)
Qualitative analysis of Western Blot of treated B16F10 melanocytes. The untreated cell showed intensity of 200, indicated the cell tyrosinase that is over expressed in other treatment at different concentration. The plot shows a statically increase in the band intensity. At the concentration of 1, 2 and 4 μg/mL, an intensity of 450, 500 and 690 with a steady increase at 4 μg/mL was observed. On increasing concentration of purified tyrosinase of A. bisporus from 8 and 16 μg/mL treatment had the similar intensity value of 800. At highest concentration of 32 and 64 µg/mL of purified tyrosinase of A. bisporus, an increase of band intensity was observed with 1100 and 1200 which are fare lesser then that of standard control (Sigma) at 64μg/mL. The data obtained by using Quantity One software.