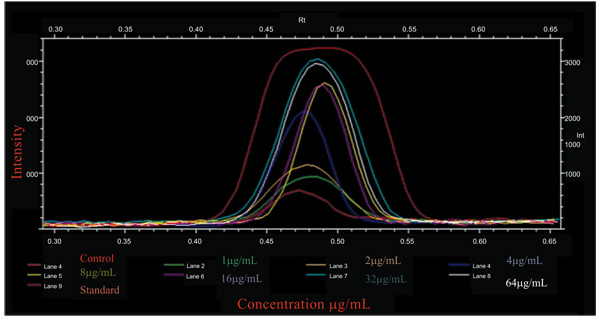
Fig. (4)
Comparative analysis of Western Blot of treated B16F10 melanocytes. The intensity profiles of all bands of absorption of tyrosinase of A. bisporus were compared on lanes graph range of intensity values. The bands were between the Rf value ranges 0.40-0.57 with maximum peak of 3200 intensity with standard tyrosinase (Sigma). The untreated cells had an intensity of 790 which was observed in all treatments with the increase of tyrosinase absorption for 1, 2, 4, 8, 16, 32 and 64 μg/mL as 950, 1100, 2000, 2590, 2600, 3000 and 2900 intensity respectively. A maximum absorption of 3000 intensity curve was shown by 32μg/mL, rather the higher concentration 64μg/mL showed a decrease in the absorption. The data obtained by using Quantity One software.