| Compounds | M. Wt. | R group | UV λmax | MICa | Log p | Docking energy |
|---|---|---|---|---|---|---|
| 1 | 238.24 | 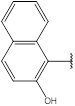 |
600 nm | 0.328± 0.01 mg/ml | +2.55 | -8.22 |
| 2 | 215.254 | 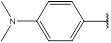 |
600 nm | 0.296± 0.13 mg/ml | +2.22 | -7.56 |
| 3 | 217.184 | 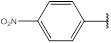 |
570 nm | Non active | +1.97 | -5.44 |
| 4 | 188.18 |  |
b | Non active | +1.55 | -6.03 |
| 5 | 204.18 |  |
b | Non active | +1.16 | -6.44 |
| 6 | 218.21 | 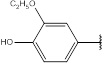 |
600 nm | 0.33± 0.03 mg/ml | +1.76 | -6.47 |
| 7 | 172.18 |  |
570 nm | Non active | +1.94 | -5.44 |
| 8 | 178.21 |  |
b | Non active | +1.92 | -4.71 |
| 9 | 206.63 | 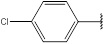 |
600 nm | 0.284± 0.05 mg/ml | +2.5 | -7.87 |
| 10 | 198.22 |  |
b | Non active | +1.83 | -4.49 |
| 11 | 162.14 |  |
b | Non active | +0.55 | -4.08 |
| 12 | 202.21 | 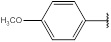 |
600 nm | 0.278 ± 0.04 mg/ml | +1.81 | -7.32 |
| Isoniazid | 0.03–0.05 mg/Lc | - 0.6 | ||||
| TLM | 210.0 | 0.0625 mg/mld | 3.00 | -6.57 |
aData are mean ± SD values.
bno change in the maximum absorption
cLiterature reported MIC [28] d Literature reported MIC [29]
bno change in the maximum absorption
cLiterature reported MIC [28] d Literature reported MIC [29]