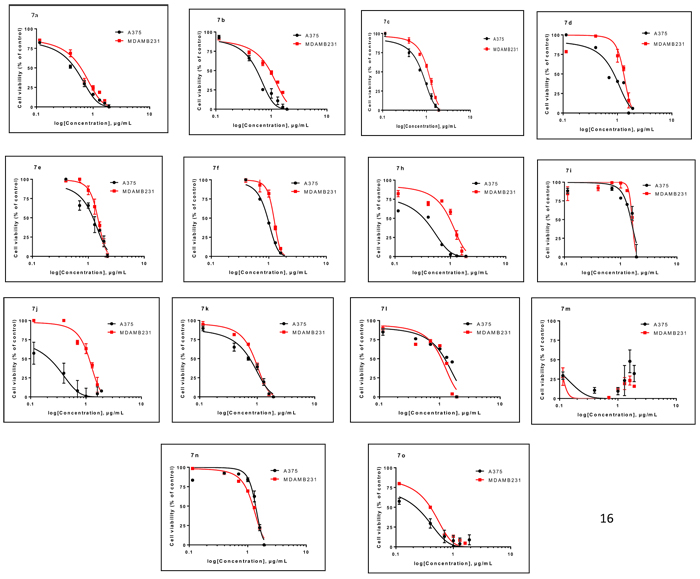
Fig. (2)
Cell cytotoxic effect of compounds. Log dose response curves were generated in Graph Pad Prism7. The doses of compound (x-axis) were log transformed and then a non-linear curve was fitted to the data using the ‘log (agonist) versus normalized response with variable slope’ algorithm. Data represent the mean ± standard deviations of three repeats.