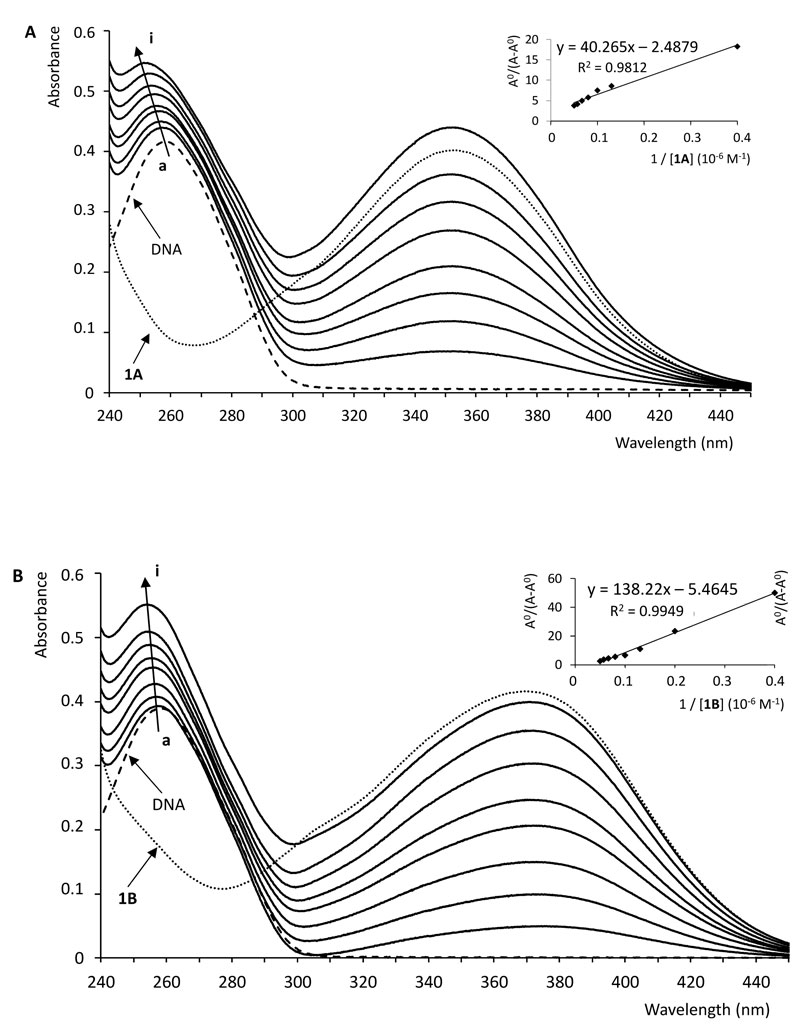
Fig. (4)
UV absorption spectra of ctDNA (50 μM) with different concentrations of compound 1A (A) and 1B (B) (pH 7.4). The concentration of 1A-B: 0 – 20 μM for curves a-i, respectively, at an increment of 2.5 μM. Inset: the plot of AO/(A-AO) versus 1/[compound] (10-6 M-1).