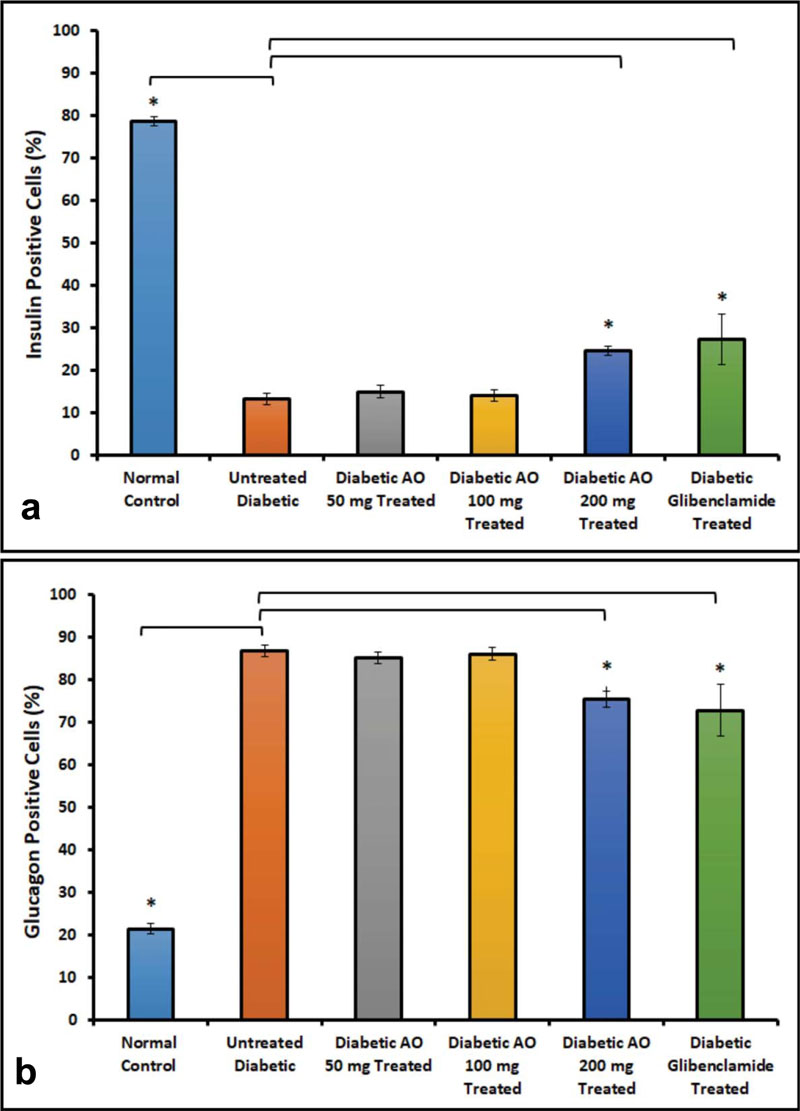
Fig. (3) Bar charts depicting the percentage number of (a) insulin-positive and (b) glucagon-positive cells in the islet of Langerhans of normal, untreated diabetic and Acridocarpus orientalis (AO)-treated diabetic rats. Note the increase in insulin positive cells with a concomitant decrease in glucagon positive cells. Data are presented as: mean ± SEM, n=6 for each data set. * p<0.05, normal versus diabetic and treated versus untreated diabetic rats.