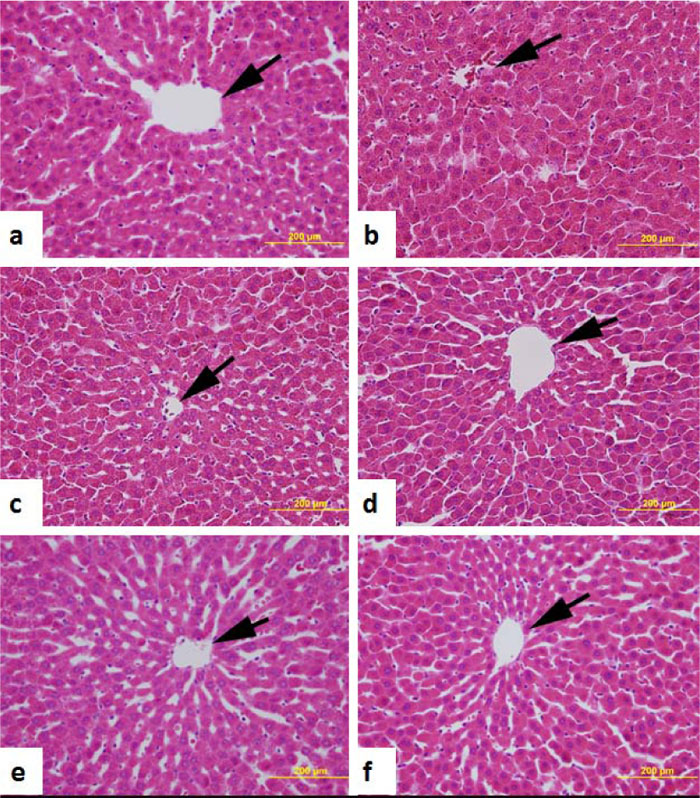
Fig. (5) Light micrographs of the liver of (a) normal, (b) untreated diabetic, (c) Acridocarpus orientalis (AO) 50 mg/kg BW-treated diabetic, (d) AO 100 mg/kg BW-treated diabetic, (e) AO 200 mg/kg BW-treated diabetic and (f) glibenclamide-treated rats. Note that the light microscopy structure of the liver is intact in AO-treated rats when compared to untreated diabetic rats. arrows = central veins. n= 6 for each data set. Scale bar = 200 µm.