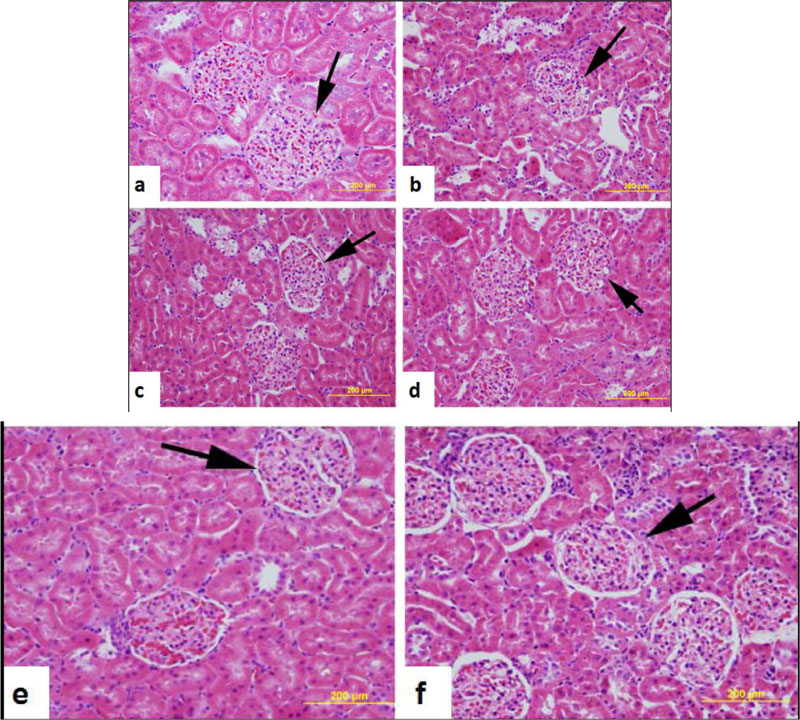
Fig. (6) Light microscope images of the kidney of (a) normal, (b) untreated diabetic, (c) Acridocarpus orientalis (AO) 50 mg/kg BW-treated diabetic, (d) AO 100 mg/kg BW-treated diabetic, (e) AO 200 mg/kg BW-treated diabetic and (f) glibenclamide-treated rats. The structure of the kidney is similar to that of a normal rat. arrows= renal corpuscles. n= 6 for each data set. Scale bar = 200 µm.