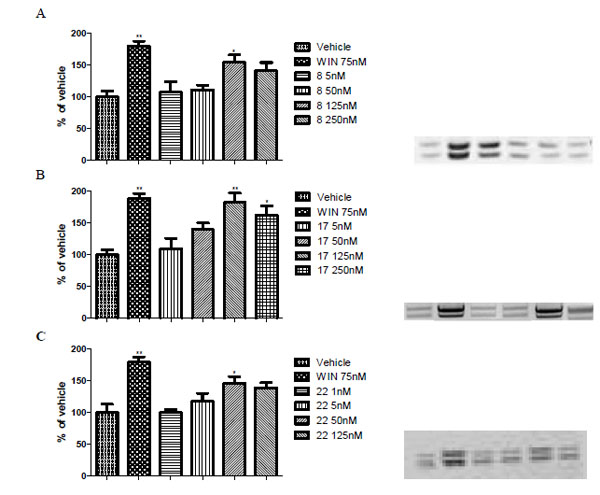
Fig. (3) Panels A-C show dose response study of P-ERK 1/2 expression following a 15 min exposure to cannabinoid receptor agonist
WIN55, 212-2 (75 nM; WIN) or to compounds 8 (Panel A), 17 (Panel B), and 22 (Panel C) at different concentrations. On the right side are
shown representative western blots of P-ERK expression. Data are expressed as mean percentage of vehicle ± SEM and are the results of five
separate experiments. *p < 0.05 vs vehicle; **p < 0.05 vs vehicle.

