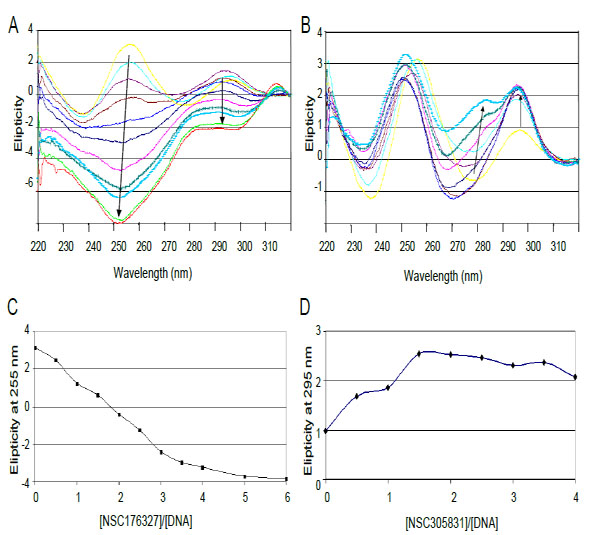
Fig. (6) CD spectra of titration of d[5'-G3(T2AG3)3] with (A) NSC 176327 and (B) NSC 305831.A. CD spectra of NSC 176327 titration.
The spectrum in yellow is DNA without ligand. Arrows indicate increasing ligand concentration B. CD spectra of NSC 305831 titration.
Colored as for A. C. Plot of molar ellipticity at 255 nm versus NSC 176327-DNA molar ratio. The spectrum equilibrates at a ratio of 4:1. D.
Plot of molar ellipticity at 295 nm versus NSC 305831-DNA molar ratio. The spectrum equilibrates at a ratio of 1.5:1.