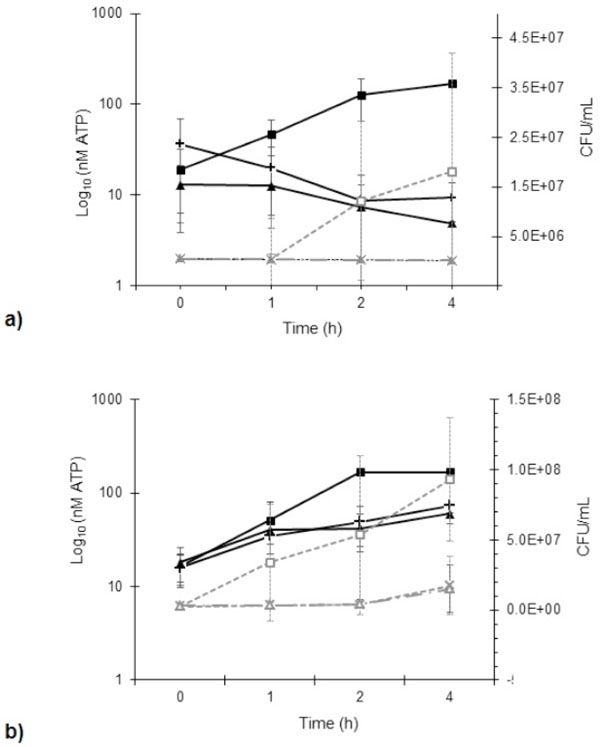
Fig. (3) Effect
on total ATP production (nM) by B. cereus (a) and S. aureus (b) in
MHB exposed to NPBD (µg/mL). ATP (―) and viable cell numbers (- - -) were
measured at each time point by the BacTitre-Glo™ ATP assay and viable counts
respectively.
B. cereus exposed to 0 (×),
16 µg/mL (■) and 32 µg/mL (▲) NPBD and S. aureus exposed to 0 (×),
8 µg/mL (■) and 32 µg/mL(▲) NPBD. Regression analysis of ATP production and
CFU/mL for increasing treatment concentrations gave R2 values of
0.94, 0.75 and 0.91 for B. subtilis respectively; and R2
values of 0.79, 0.74 and 0.67 for C. albicans respectively.