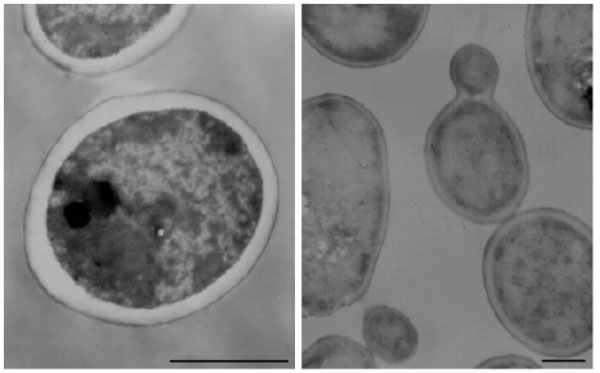
Fig. (8)
Transmission electron micrograph of
Candida albicans
. Left:
C. albicans
untreated. Right:
C. albicans
exposed to 4 μg/mL NPBD for 24 h. Scale bars represent 1.5 µm.