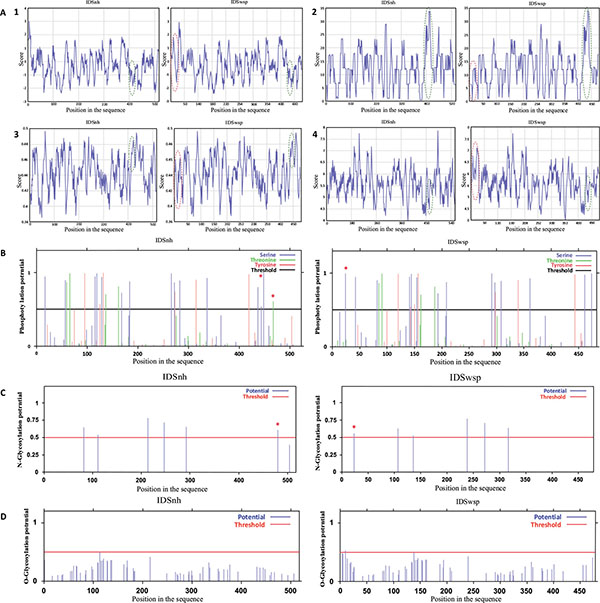
Fig. (2) (A). Profiles obtained in the analysis of the primary structures of IDSnh and IDSwsp 1. Hydrophobicity, 2. Polarity, 3. Flexibility, and 4. Accessibility of IDSnh and IDSwsp. Highlighted in red are the areas of the amino terminus zones of the IDSwsp; presented as additional amino acids due to the expression vector sequence. Green represents the comparison between the IDSnh areas corresponding to the mutations found in the IDSwsp. (B). Potential phosphorylation sites of IDSnh and IDSwsp using the NetPhos 2.0 * program.(C). Potential sites of N-glycosylation of the IDSnh and IDSwsp using the NetNGlyc 1.0 * program.(D). Potential sites for O-glycosylation of the IDSnh and IDSwsp, using the NetO-Glyc 3.1 * program. The differences are marked with an asterisk (*).