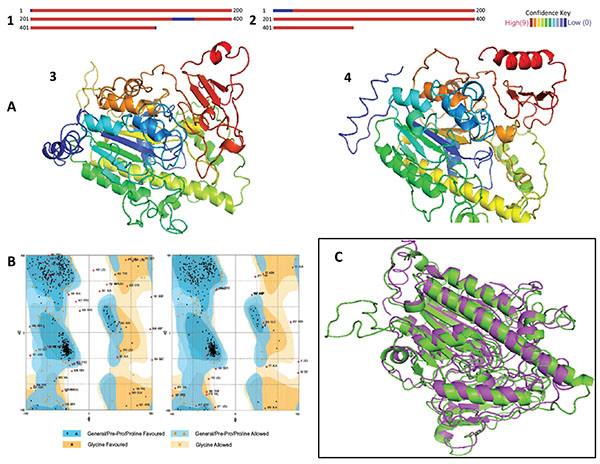
Fig. (3) (A). Results of homology modeling and 3D models.1. IDSnh. 2. IDSwsp. The red areas indicate that the confidence level of the model is high, while blue colors indicate low confidence levels. 3 and 4. The models represent the 3D configuration of the IDSnh and the IDSwsp, respectively. The variations observed relate mainly to the additional amino acids in the amino and carboxyl terminus present in the IDSwsp. (B). Representation of the Ramachandran Plot, obtained for the IDSnh and the IDSwsp, respectively. It indicates whether the interatomic distances and torsion angles of the peptide bonds are in allowed regions in the majority of amino acids. (C). Superposition of the IDSnh and the IDSwsp. Green indicates the structure corresponding to IDSnh and purple indicates the structure corresponding to IDSwsp. The RMSD obtained was of 2.12 Å.