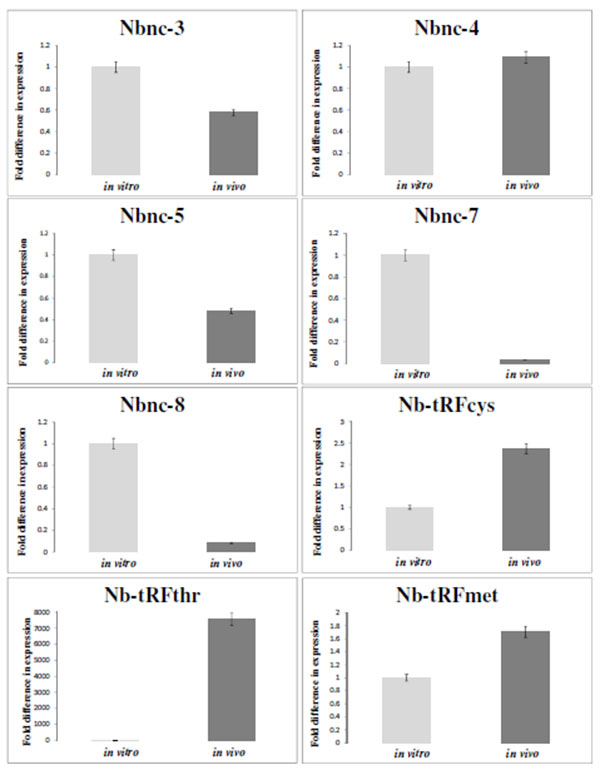
Fig. (2)
The validation of the RNA-Seq results by qRT-PCR and changes in the in vitro and in vivo expression levels. Differential expression levels of eight selected transcripts were determined. The Y-axis values indicate the fold change differences in expression and were calculated using the 2ΔΔCt parameter. qRT-PCR data represent the mean of three independent experiments. Error bars represent the standard deviation.