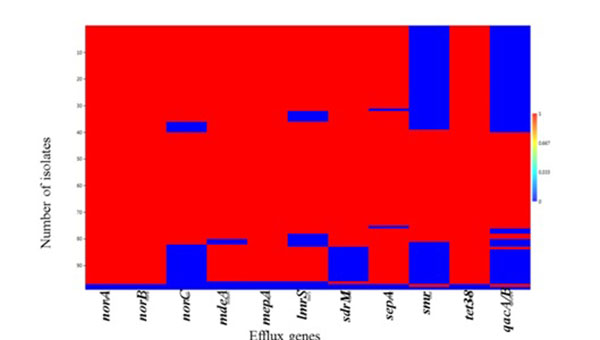
Fig. (1)
Heatmap matrix showing a visual representation of the distribution pattern of the 11 MDEs in MRSA and MSSA isolates. The blue reagions indicate the set of isolates in which an MDE was not detected while the red regions indicate the set of isolates in which the MDEs were detected by PCR. A similarity in the distribution pattern of qacA/B and smr; norA and norB can be seen.