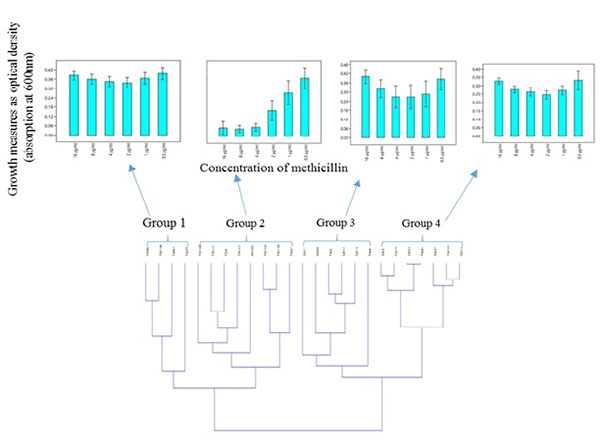
Fig. (2)
A: A dendrogram showing the co-clustering of clinical MRSA and MSSA isolates. B: Cluster-dependent heterogenic growth response to methicillin based on the general trend of the contribution of each isolates in a cluster. The error bar shows standard error from the mean. Groups 1 and 2 show exclusive clustering of MRSA while Groups 3 and 4 show co-clustering of MSSA and MRSA isolates. Samples ID with SA are MSSA and those with TA are MRSA.