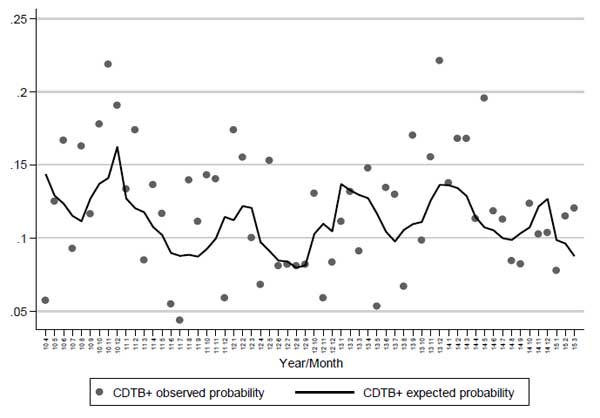
Fig. (4)
Observed proportion of CDTB positivity and probability of positivity expected plotted against months/years.