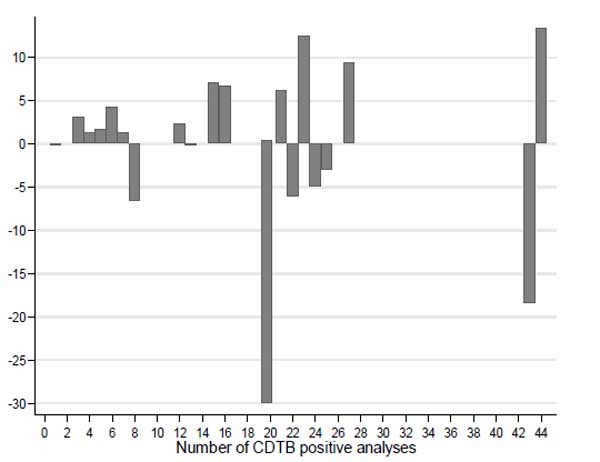
Fig. (6)
Plotting of difference between observed and expected CDTB positivity by combining wards with equal numbers of events.