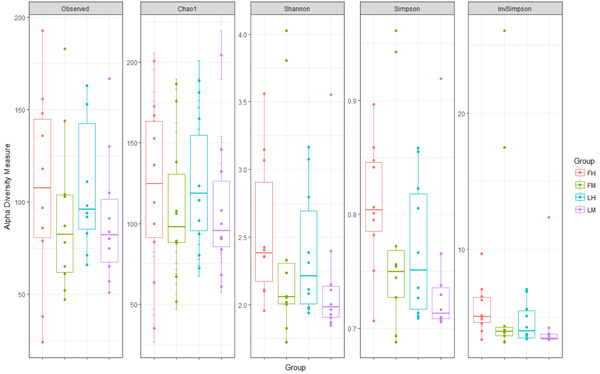
Fig. (1)
The Shannon, Simpson, Chao1, InvSimpson and observed indexes of fish communities regarding experimental group (M for midgut, H for hindgut, F for fat line and L for Lean line). The interquartile range is represented by the outer bounds of the boxes, the median is represented by the midline and the outliers are represented by the circles (O). The whiskers represent the minimum and maximum values.