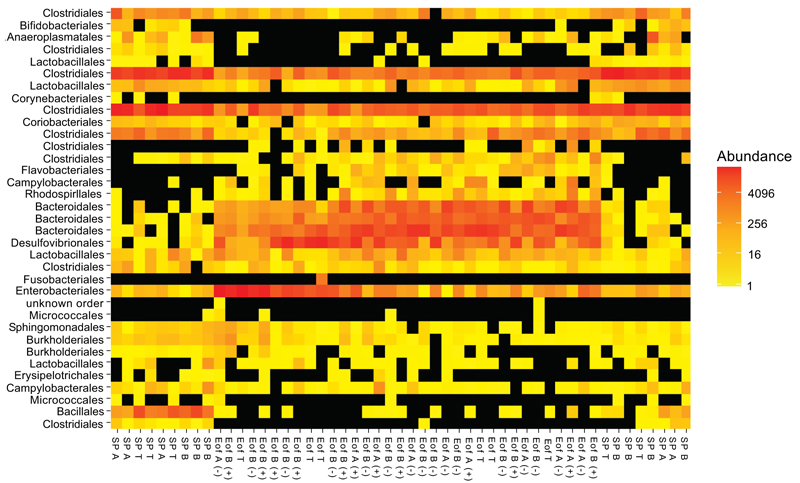
Fig. (5)
Heatmap representation of cecal microbiota at family level. Samples and OTUs were clustered using nMDS ordination with the Bray-Curtis ecological distance method. The different families are indicated at the level of the order. Samples were indicated according to experimental group.