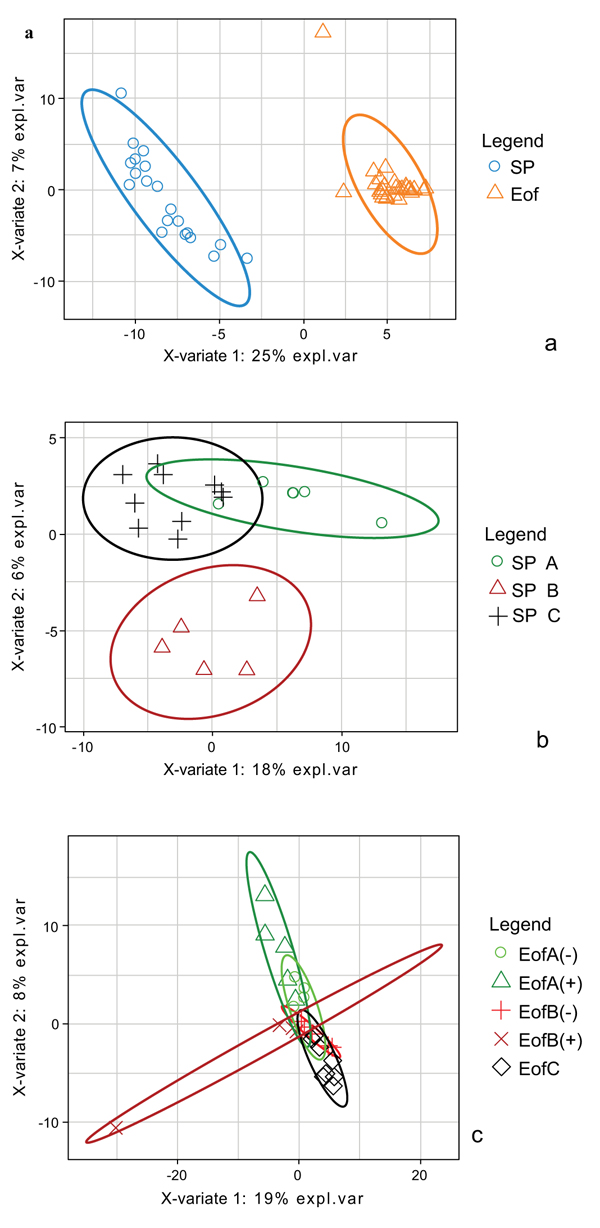
Fig. (6)
Sparse Partial Least Square Discriminant Analysis (sPLS-DA) of the ileal microbial community (a) before and after overfeeding independently of experimental 2 group, (b) between the three experimental groups during the rearing period, (c) between the five experimental groups after the overfeeding period according to the first two explanatory variables. Control groups before and after overfeeding are represented in black while the experimental groups with probiotic A are represented in green and groups with probiotic B in red.