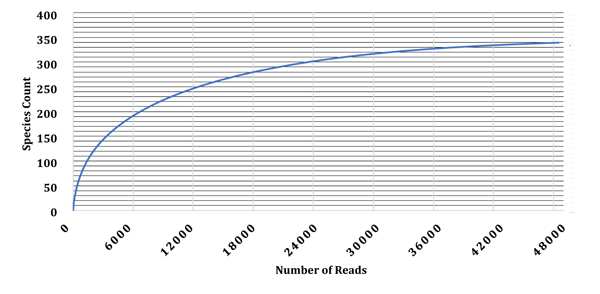
Fig. (2)
The rarefaction curve was computed using MG-RAST pipeline with distinct species annotations showing the richness of the granular sludge collected from the UASB reactor.