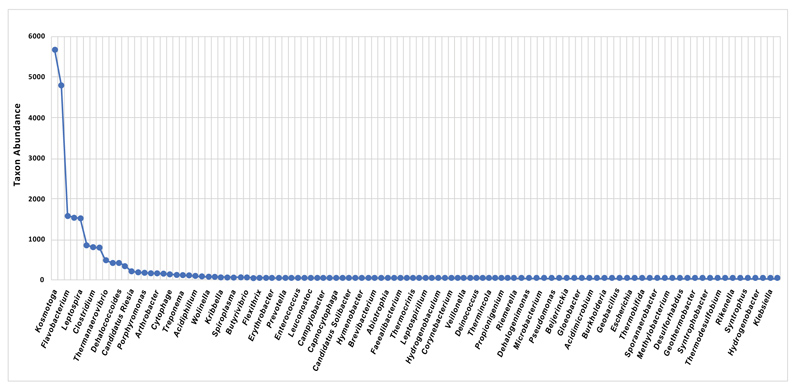
Fig. (4)
Rank abundance curve showing the taxonomic abundances and species richness of microbial community in the granular samples taken from the UASB reactor based on data generated for 16S metagenomics sequencing; ordered from the most to the least abundant.