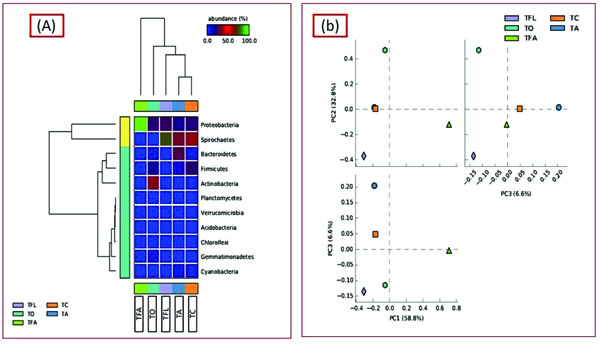
Fig. (7)
(a)
Heat map indicating a significant variation in the relative abundance of different bacterial communities of (TO), (TA), (TFL), (TFA), (TC)
(b)
PCA plot of (TO), (TA), (TFL), (TFA) and (TC).