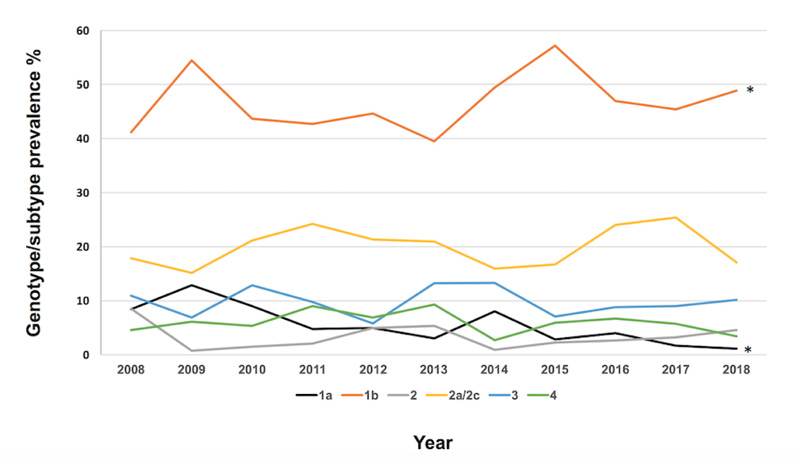
Fig. (2)
Dynamic distribution of six more prevalent genotypes/subtypes. The asterisk indicates a p-value <0.001 calculated by Chi-square test for linear trend.