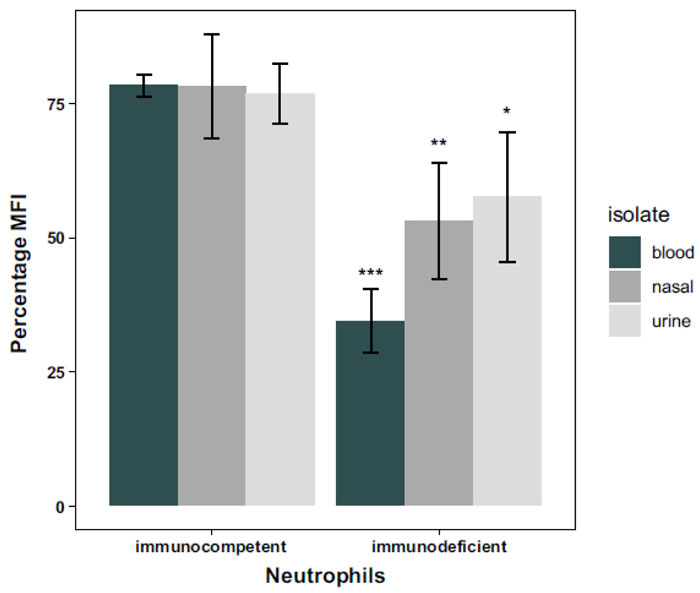
Fig. (4) The effect of individual type and isolate type on the percentage of phagoburst response of the neutrophils. The height of each bar represents the mean of each group, and the error bars represent the standard deviation of the mean. Two-way ANOVA, simple effects, and Tukey post hoc method were used to test for significant differences between the groups as detailed in the text. Each significance level represents comparison with the corresponding healthy value determined by adjusted p-values for multiple comparisons. All post hoc significance levels represent an adjusted p-value < 0.05. (*:< 0.05, **:< 0.01, ***:< 0.001).