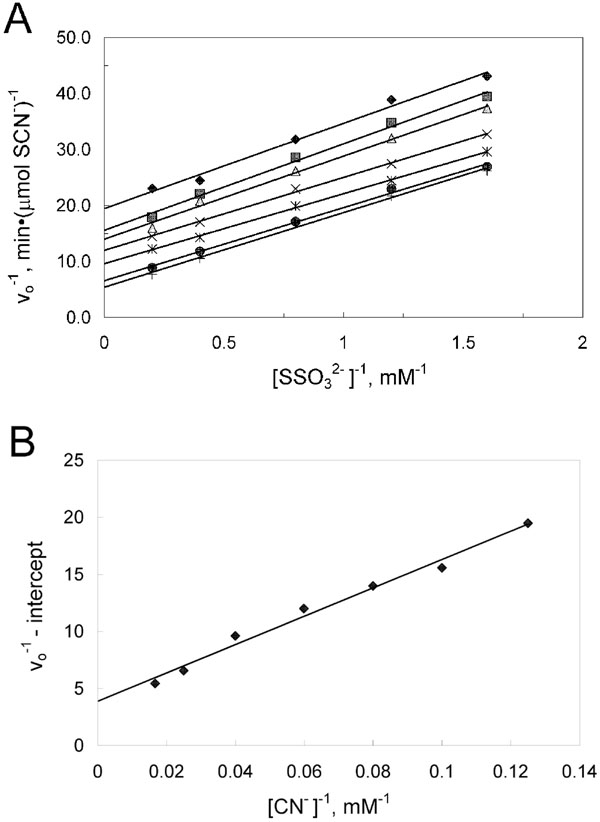
Fig. (5) Kinetic characterization of the thiosulfate:cyanide sulfurtransferase reaction catalyzed by PspE. Each assay contained 0.63 μg of purified PspE2 and 1 mM cysteine. (A) Doublereciprocal plot of the rate of thiocyanate formation versus thiosulfate concentration at various fixed concentrations of cyanide: 8 mM (♦), 10 mM (■), 12.5 mM (▲), 16.7 mM (×), 25 mM (*), 40 mM (a), 60 mM (+). (B) Secondary double-reciprocal plot of apparent Vmax values from the data in panel A versus cyanide concentrations.