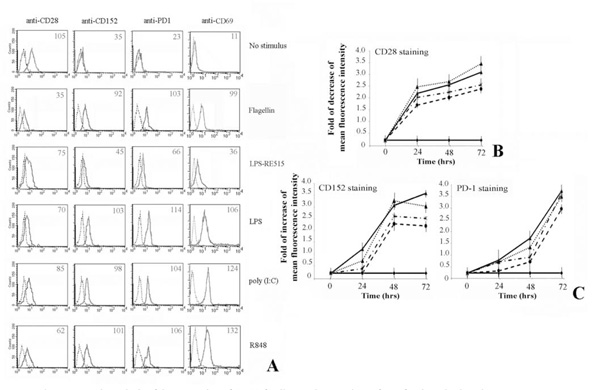
Fig. (1) Flow cytometric analysis of the expression of CD28-family members on the surface of activated T lymphocytes.Human CD4+ T lymphocytes, purified from peripheral blood cells, were cultured as described in Materials and Methods.Panel A. Shows that T cells activation via TLRs is able to up-regulate the expression of CD152 and PD-1 at the membrane cell level. Expression of CD69 was a positive control for T lymphocytes activation. Numbers indicate the Mean Fluorescence Intensity of each curve.Panel B. The expression of CD28 decreases following treatment of T cells with flagellin, poly (I:C) and R848. Data are shown as means ± standard deviations (error bars) of five experiments.Panel C. Shows the increasing of respectively CD152 and PD-1 expression. It is interesting to note that CD152 reaches the maximum of expression after 48 hrs, whereas PD-1 after 72 hrs. Data are shown as means ± standard deviations (error bars) of five experiments.Experimental conditions are: ♦ no stimulus; ▼ flagellin; ▲ + LPS; * poly (I:C); ● R848.