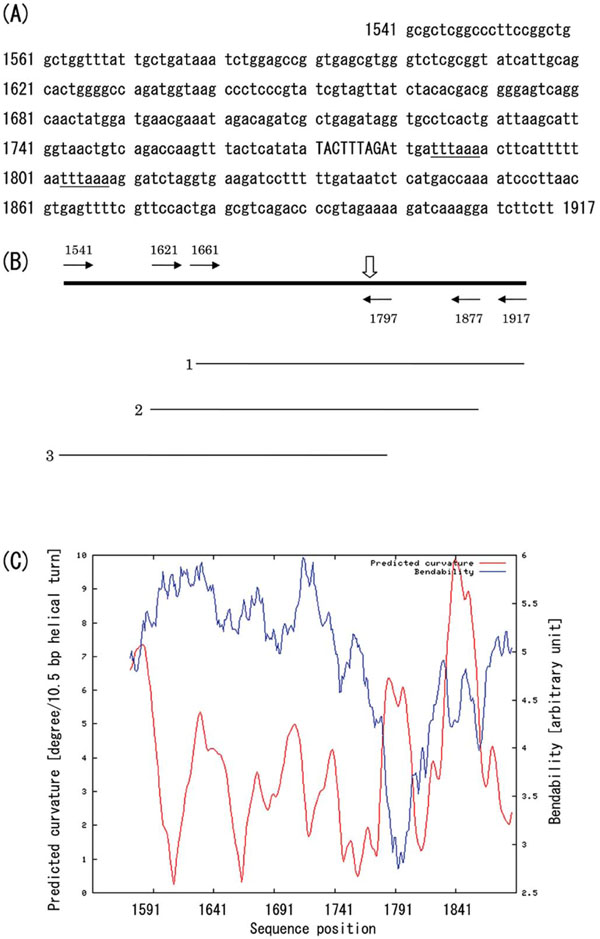
Fig. (4) Schematic representation of the IS10 target region.(A) Nucleotide sequence of the IS10 target region in pUC19 vector. The integration site (9-bp segment) is indicated by capitals, and two closely located Dra I restriction sites are underlined. (B) Map of the PCRamplified fragments. Horizontal arrows labeled with nucleotide positions indicate the location of the 5’-termini of the PCR primers, and the vertical open arrow indicates the site of IS10 insertion. Thin horizontal lines labeled 1-3 show the PCR-amplified fragments fractionated by native polyacrylamide gel electrophoresis (Fig. 3). (C) Predicted curvature and bendability. The bendability/curvature propensity plots were calculated with the bend.it server [19] using the DNase I based bendability parameters of Brukner et al. [25] and the consensus bendability scale [26]. Bendability was plotted in cyan, and the predicted curvature was plotted in magenta.