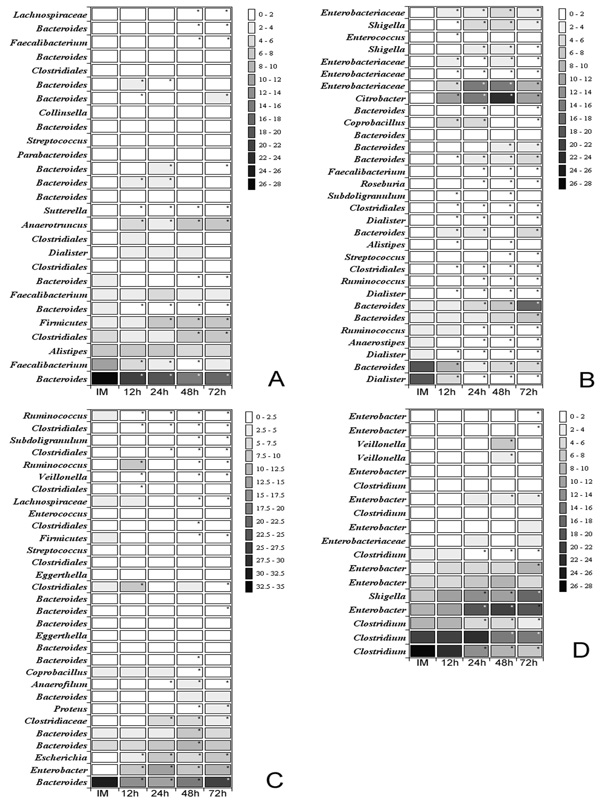
Fig. (2) Heat map showing the proportion of bacteria found at different times of storage (immediately (IM), after 12h, 24h, 48h and 72h) and the significance of the variation observed. Maps A, B, C and D represent the subjects analyzed. The scale on the right represents the contribution of a particular OTU and it is expressed in percentage of the total. The closest bacterial relative is shown in the left side of the map. Note that OTUs were classified to the highest specificity level, ranging from phylum to genus.