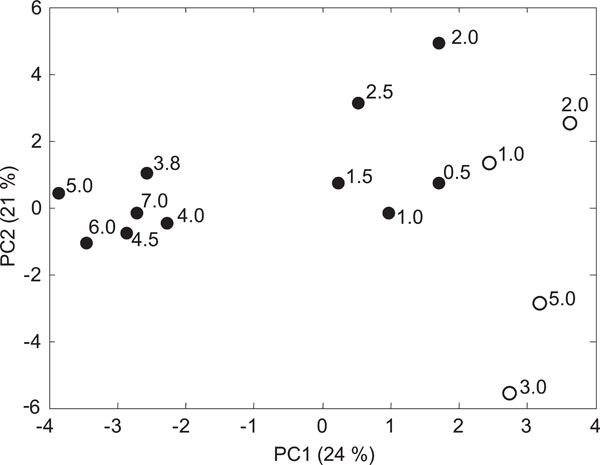
Fig. (1) Biplot of soil samples in principal component analysis (PCA) based of the molar ratios (mol%) of PLFAs from the contaminated soil profile (filled symbols) and the clean soil profile (open symbols). Numbers next to the symbols indicate the higher limit of the corresponding soil profile. ω