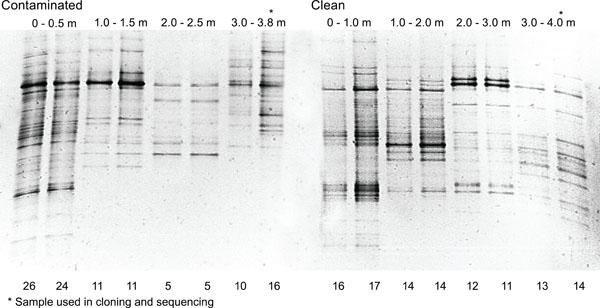
Fig. (3)
DGGE profiles of
Actinobacteria
in contaminated and clean soil profiles. The result from two parallel DNA extractions are shown. Number of bands detected in the soil profiles are indicated below the figure at each band.