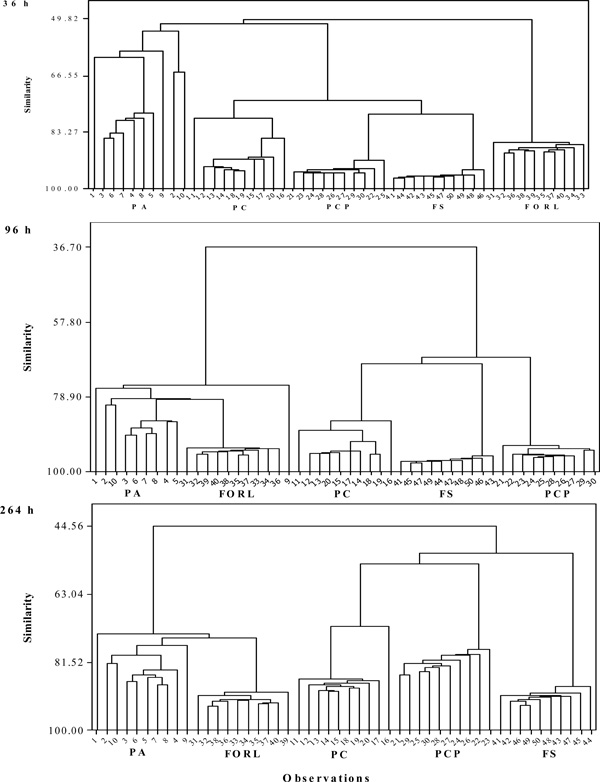
Fig. (2) Dendograms obtained by cluster analysis indicating the similarity between the metabolic profiles of pure cultures of Phytophthora cryptogea (PC; observations 11-20), Phytophthora capsici (PCP; observations 21-30), Pythium aphanidermatum (PA; observations 1-10), Fusarium oxysporum f.sp. radicis-lycopersici (FORL; observations 31-40) and Fusarium solani (FO; observations 41-50) after 36, 96 and 264 h of incubation on Biolog GN2 panels.