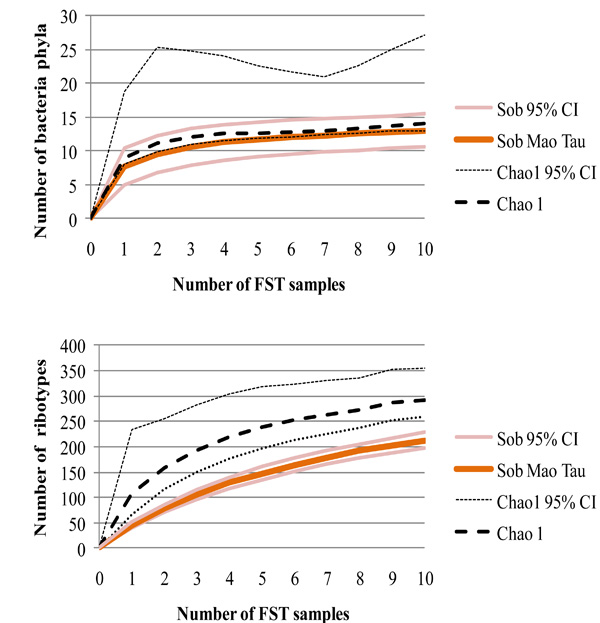
Fig. (2) Rarefaction curves of bacterial phyla and ribotypes depending upon the number of FST samples. Observed richness of phyla and ribotypes (Sob) was measured based on the Mao Tau index. Total richness was estimated using Chao 1. Upper and lower 95% confidence intervals are given.