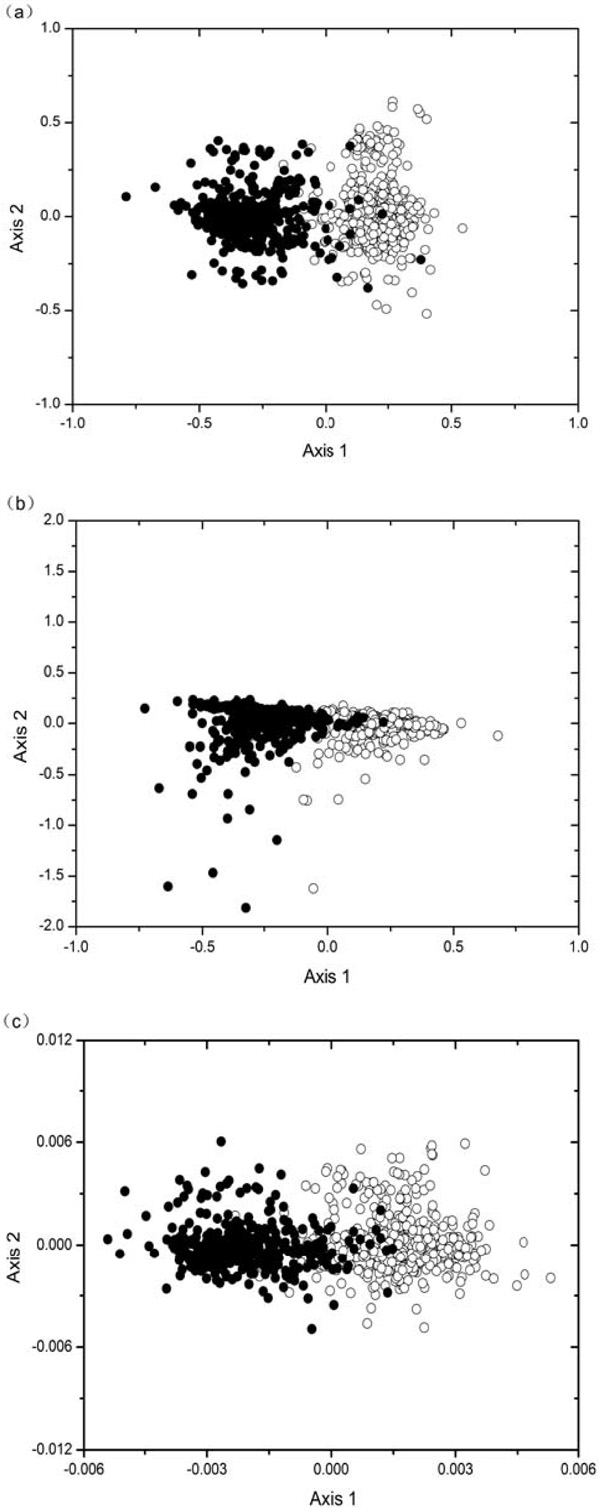
Fig. (1) The distribution of points based on the two most important axes by using the COA for 925 genes of the E. canis genome. Genes located on leading strands are denoted by open circles, whereas filled circles indicate lagging strand genes. (a) COA on codon counts; (b) COA on RSCU values; (c) COA on nine variables (u1-u9) of phase-specific Z curve.