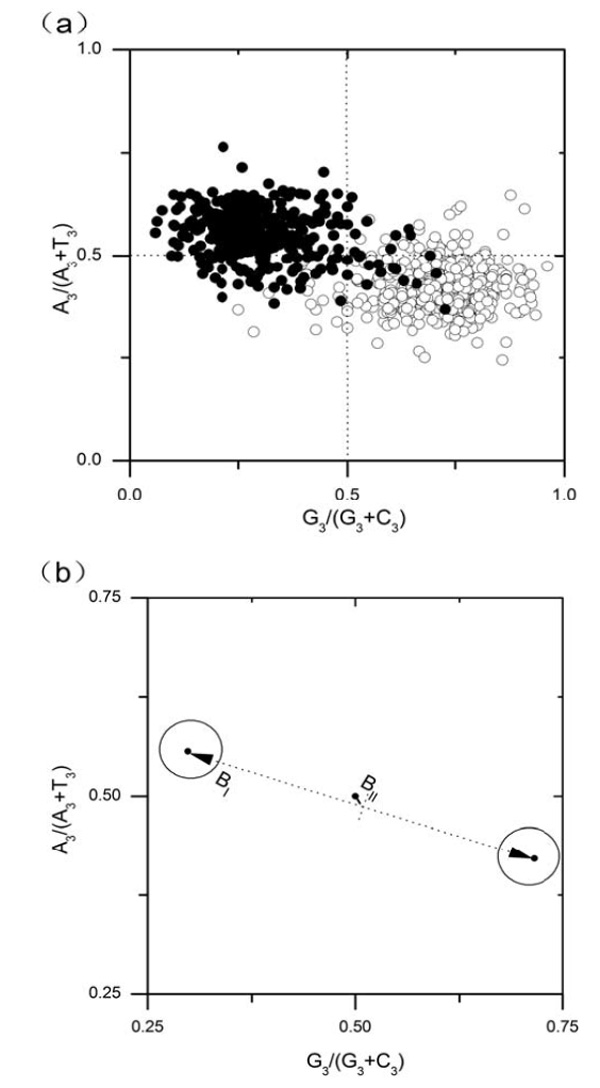
Fig. (3) PR2-plot for E.canis chromosome. Genes located on the leading strands are denoted as open circles, whereas filled circles indicate lagging strand genes. In figure (a), each gene is denoted by a circle and whereas in (b), each category of genes, as a whole, is denoted by a larger circle.