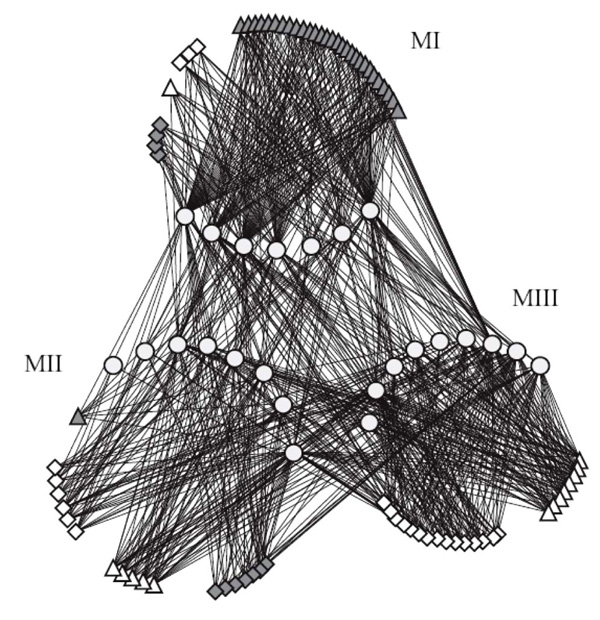
Fig. (4). Network representation of the occurrence of traits analyzed in E. coli isolates. Circles represent each trait (see material and methods). Strains associated with different diseases are represented by different combinations of geometric figures and colors as follows: gray triangles = commensal strains (AFEC), gray diamonds = omphalitis strains, blank triangles = swollen head syndrome strains, blank diamonds = septicemia strains. An edge between a strain and a trait indicates that the trait was detected for that strain. Each module identified by the SA algorithm is labeled accordingly (MI, MII, and MIII).