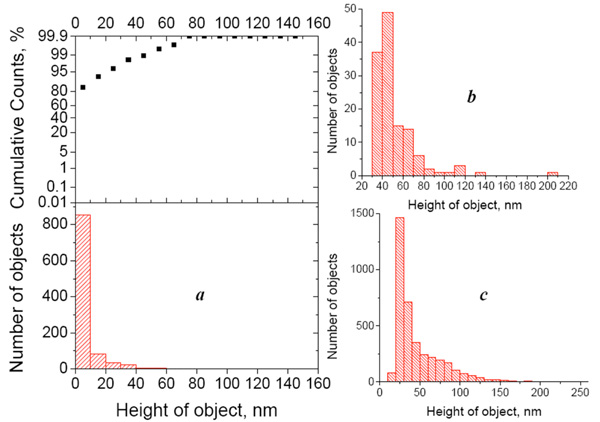
Fig. (3) (a) Height distribution histogram (bottom) of objects detected in the control AFM image (Escherichia coli- affinitive surface
exposed to the buffer) and integral probability function (top). (b) height distribution histogram of objects detected in the AFM image of the
cross-control sample (Escherichia coli- affinitive surface exposed to the suspension of Bacillus subtilis fragments with the concentration 108
cells/ml). (c) Height distribution histogram of objects detected in the AFM image of the Escherichia coli- affinitive surface exposed to the
suspension of Escherichia coli fragments with the concentration 108 cells/ml. All histograms were built for the particles detected from 50x50
µm2 AFM images.