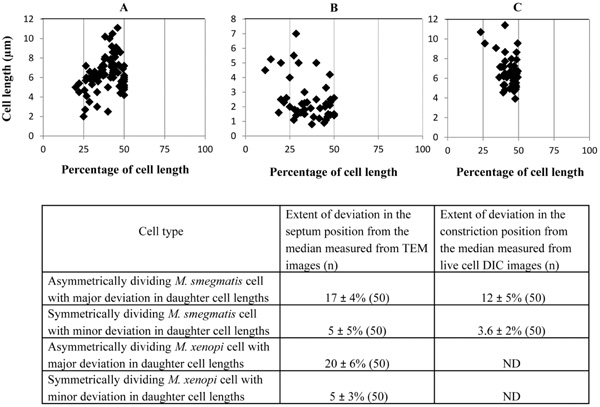
Fig. (2)
Position of the septum and constriction in the highly deviated asymmetrically
dividing M. smegmatis and M. xenopi cells.
(A,
B)
Placement of septum with respect to cell length from the TEM images of M.
smegmatis and M. xenopi cells, respectively (n = 50 cells with
septum).
(C)
Position of the constriction in M. smegmatis cells from live cell
time-lapse images. (n = 50 cells with constriction). The average values from
(A-C)
have been tabulated and shown below.