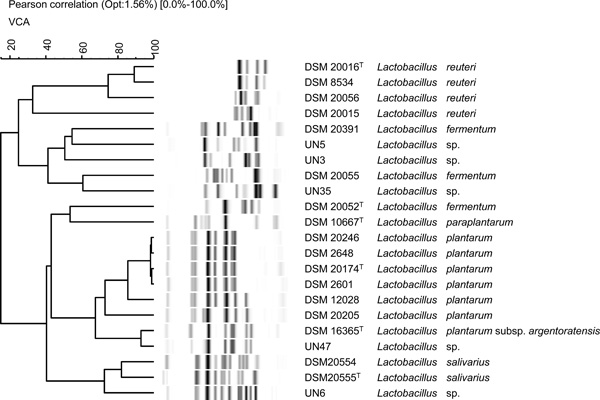
Fig. (3) Riboprint patterns of the isolates UN3, UN5, UN6, UN35 and UN47. Cluster analysis was performed by UPGMA based on the Pearson correlation (Opt: 1.56%) [0.0%-100.0%]. VCA indicates a standard EcoRI batch. The molecular masses of the bands range from 1 kb (right) to 60 kb (left).